Module Construction
Network modules were constructed using the Louvain method (version 1 networks) or the nested Leiden approach (version 2 networks). Clustering was applied to the filtered network, which contains only the genes and edges retained after edge filtering and prioritization, rather than to the full correlation matrix. Each module was labeled based on its top enriched GO:BP terms and their relationships within the GO hierarchy.
In version 1 networks, modules were used only to assign the network core gene and network specific gene lists, described under Mavatar Curated Gene ListsMavatar Curated Gene Lists, into gene modules and are not available as stand-alone lists. For later version 2 networks, the modules are also provided within Mavatar Discovery. The total number of modules is shown in the DINA NetworkDINA Network card, and the HighlightHighlight tool can be used to identify graph genes that belong to specific modules.
The Biological RelevanceBiological Relevance of the network core gene and network specific gene lists, based on Louvain modules, has been extensively validated, as have the gene list similarity scores in the DINA Network Similarity ValidationsDINA Network Similarity Validations. For version 2 networks, the improvements in module quality and robustness were further evaluated using both structural metrics and biological validation criteria.
Comparative Analysis of Various Community Detection Methods and Implementations
To evaluate alternative methods for module construction, the modularity, stability, module size distributions, and within–between separation were calculated using various community detection methods with networks of various parameter set-ups. It was also tested how the edge prioritization would affect the modularity. Based on these analyses, it was concluded that using a sparse network based on a low number of neighbors negatively impacts the modularity, and that by increasing the number of neighbors from 20 to 50 we were able to improve modularity and stability. The updated edge prioritization methods, described under Network Version InformationVersion Information, further increased graph density with improved community detection as a result.
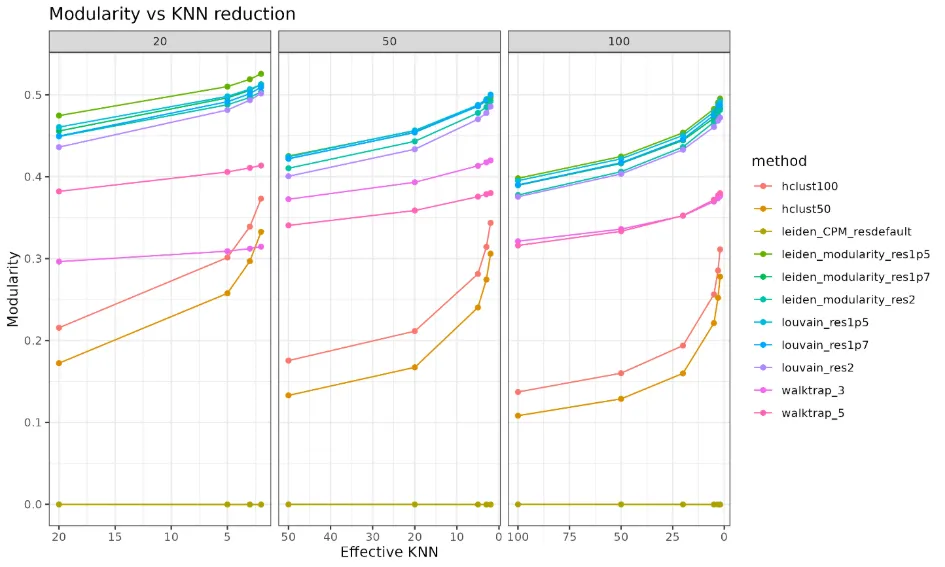
Fig 1. Modularity shift over various number of K Nearest Neighbors (KNN) and methods. The figures come from analyses of the Brain – General network.
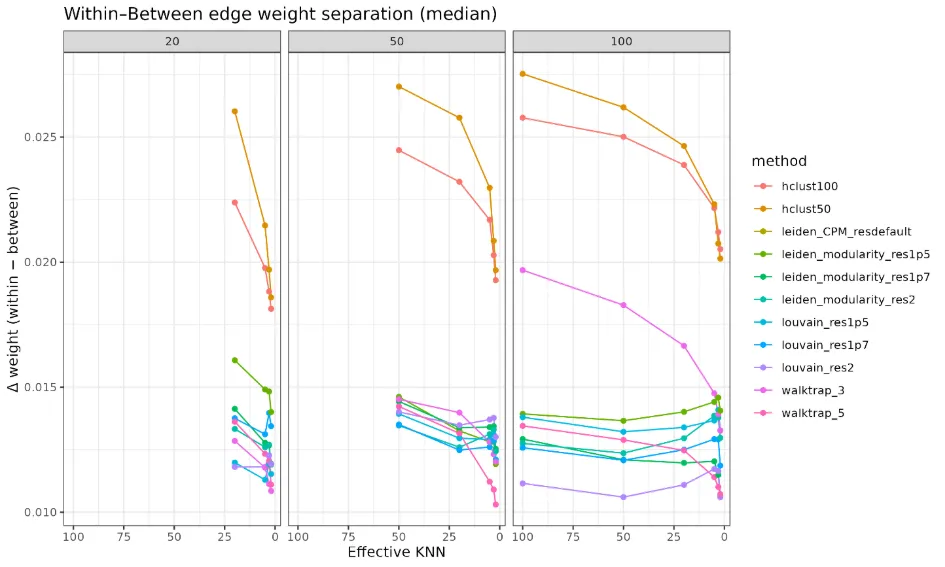
Fig 2. Within-Between edge weight separation shift over various number of KNN and methods. The figures come from analyses of the Brain – General network.
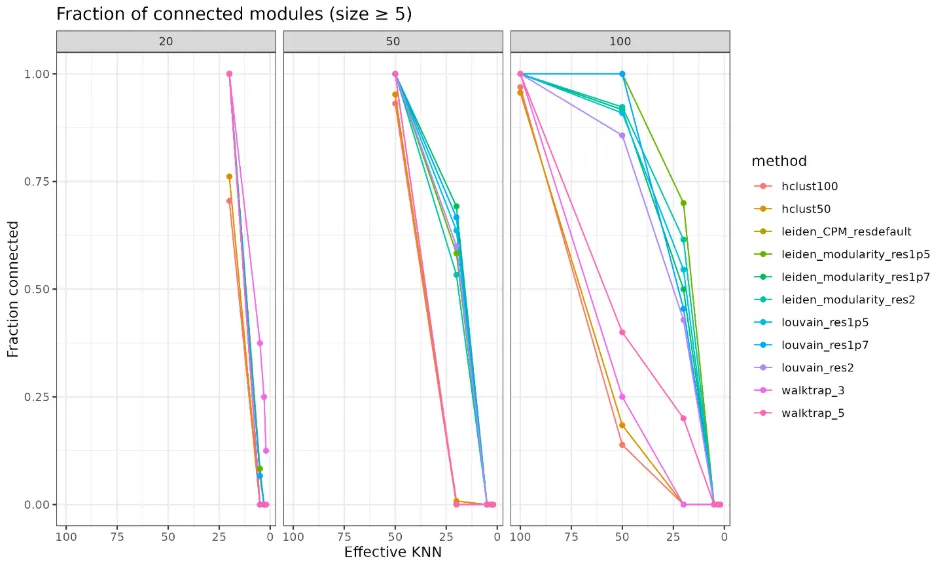
Fig 3. Fraction of connected modules over various number of KNN and methods. The figures come from analyses of the Brain – General network.
Louvain and Leiden produce nearly identical partitions across all evaluated metrics (modularity, stability, module size distributions, and within–between separation). The determining distinction was that Leiden, as compared to Louvain, did not force unconnected genes into small modules but kept them unconnected, yielding a higher degree of internally connected communities. We thus decided to standardize the method based on Leiden..
Nested Leiden – Solve Trade-off Between Stability and Granularity
Individual community detection methods lead to a trade-off between stability and granularity, where the Louvain- or Leiden-based method produced the most robust modules, though often too coarse for our application. In contrast, hierarchical clustering yielded more fine-grained modules but showed high instability. We solved this trade-off by implementing a nested Leiden community detection strategy, verifying continued modularity and community stability as previously shown. During this strategy, Leiden was first applied to the full graph to obtain coarse, stable parent modules. Parent modules exceeding a predefined size threshold were then recursively re-partitioned using Leiden at the same resolution, producing finer-grained submodules while preserving the global structure of the network.
Biological Interpretation and Naming of the Modules
For each module derived using the nested Leiden method, GO:BP enrichment was performed separately to evaluate its biological relevance and connection within the parent modules. The results showed a biologically structured decomposition of the tested tissue into functional compartments rather than random enrichment noise. These validation analyses were run on the Brain – General, Bone Marrow – General, and Large Intestine – UC networks. Below results shown are from the Brain – General network, but the same comclusion could be drawn from all tested networks.
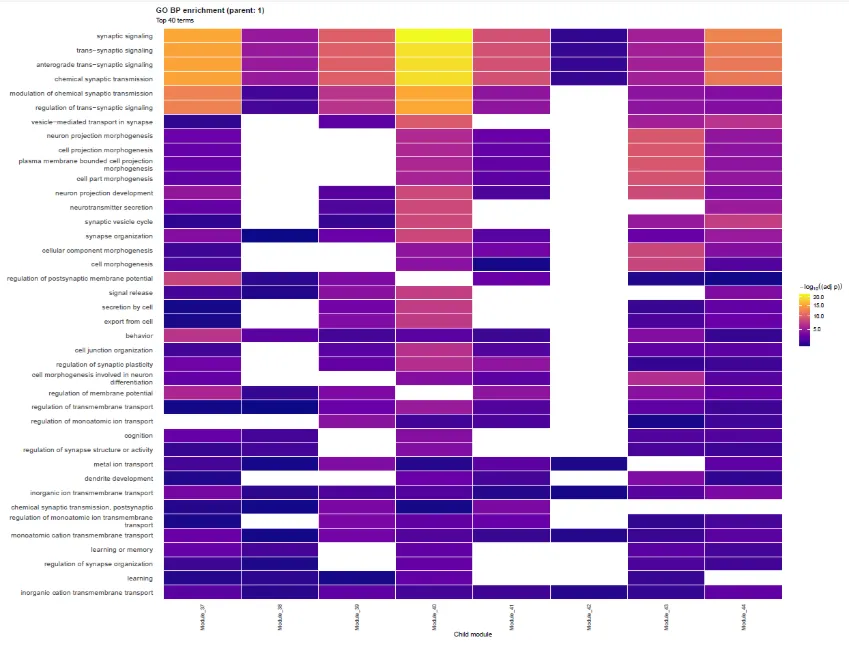
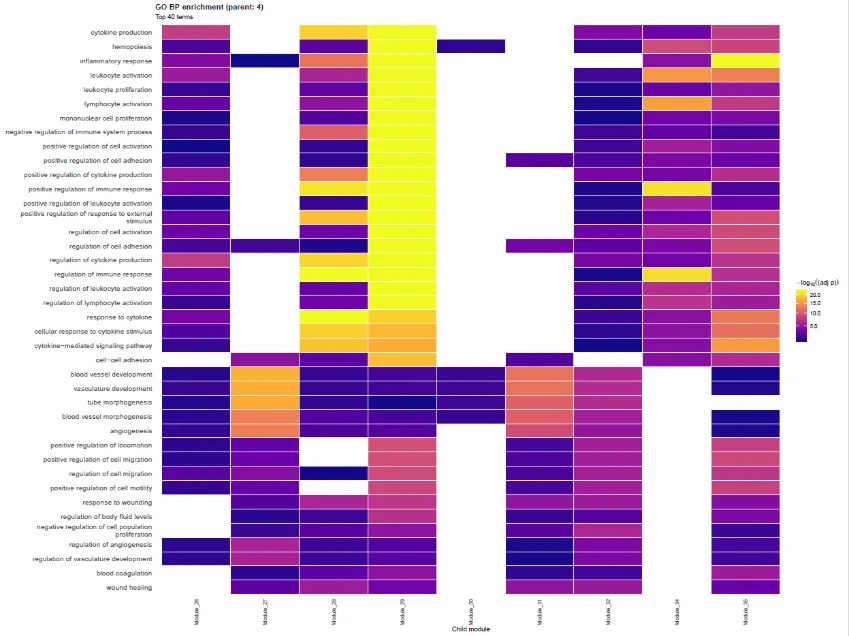
Fig 4. Heatmaps showing the -log10(p values) from GO:BP enrichment of module-genes within parent module 1.
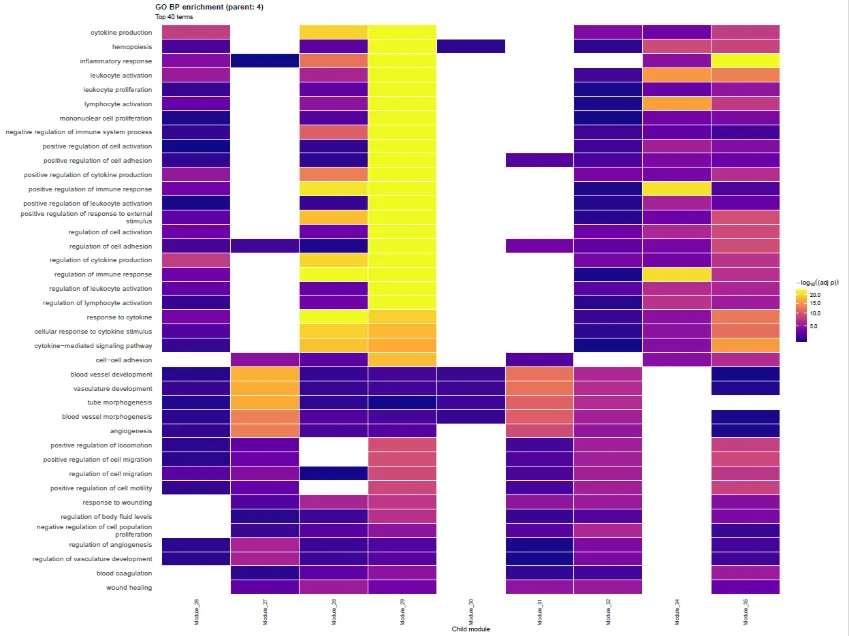
Fig 5. Heatmaps showing the -log10(p values) from GO:BP enrichment of module-genes within parent module 4.
Across brain, large intestine, and bone marrow, the parent-level hierarchy consistently resolves a limited set of major biological themes. Some represent core cellular infrastructure present in all tissues, including translation/ribosome biology, RNA and chromatin regulation, and mitochondrial energy metabolism. Alongside these shared axes, each tissue shows clear defining programs: synaptic signaling and myelination in brain; immune activation, secretion, and epithelial functions in large intestine; and adaptive immunity, innate immune programs, and hemopoiesis in bone marrow. The fact that these themes span multiple child modules indicates that the hierarchical structure captures broad, biologically coherent organization rather than isolated enrichment results.
A recurring feature across datasets is the presence of sensory/GPCR/olfactory receptor–annotated terms. These likely reflect large gene families and genomic clustering effects and should be interpreted as structural components of the network rather than primary tissue-defining biology. In contrast, the dominant tissue-specific axes are clear and internally consistent. The parent grouping highlights how individual modules cluster into broader, biologically consistent themes across tissues. This supports the internal coherence of the modules and shows that the hierarchical structure reflects structured biology rather than arbitrary partitioning.
The enrichment patterns show internal coherence at the module level: modules grouped under the same parent consistently share related functional themes and do not display arbitrary mixtures of unrelated processes. This functional consistency supports the biological validity of the module partitioning and serves as an independent validation of the network structure, as well as enabling the use of GO term association for module naming.